Dashboard Design and Development
Dashboards are a glimpse of key performance indicators and metrics for business intelligence all at one location. Corporates informative dashboards to keep an eye on business performance. A dashboard might provide a detailed view focused on a single department or can also provide a broad performance analysis of the whole company.
In this upcoming blog we will look at:
- 1. Factors which have been proven effective in dashboard development projects
- 2. A brief of Dashboard Design Process
1. Dashboard Development Factors
- Understanding the needs of business clearly- Start by creating dashboards that solve real business problems for the company. To differentiate between the absolute need of the client and “nice to have” feature is the key. To identify the formula is ‘who needs a dashboard display (what is the position of that individual at the company) for what purpose (the problem that needs to be solved by dashboard) and why it is needed (the functions that should be present on the dashboard display.
- Visually sophisticated and basic- At a glance the dashboard should be easy to look at. To include the business metrics and statistics all in one frame could be a challenging task. What at the start seems like a important field might not appear good in the dashboard. The size of layout of a particular data should depend on factors like how much values does it hold in the business, the frequency of need to see that metric on display screen, the update time, and many such things.
- User adoption adds value- Crucial in every project is user adoption. If the user cannot use the dashboard its merely a display dummy. If the brand new dashboard just regulated the same old given data then it might not be compelling enough for user to adapt with the changes.
2. Dashboard Design Process
We will see this process in 4 stages
- 1. Define
- 2. Prototype
- 3. Build
- 4. Deploy
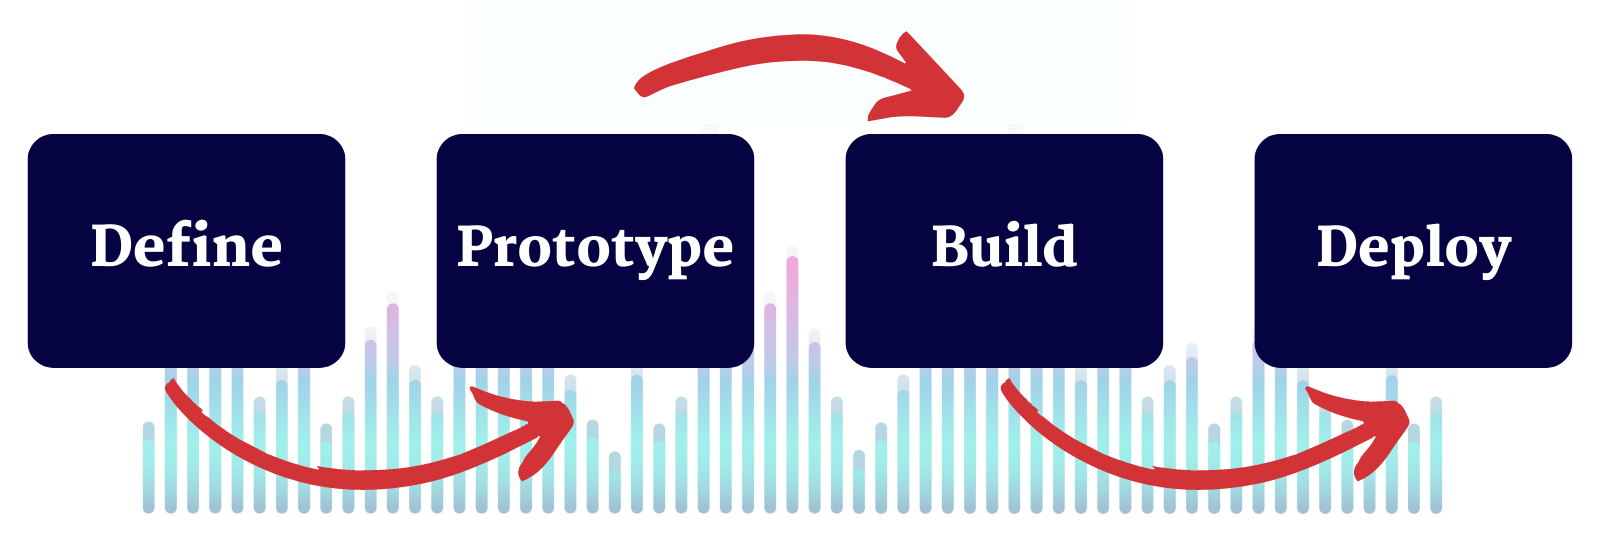
- Define: As mentioned above in this blog, While designing a dashboard the fist and the main step is having a clarity about who this dashboard is for and what metrics mean to them is most important to designing a dashboard that will be used.
- Prototype: Now that we have collected all the necessary data and metrics that we want in our dashboard, we have to plot out the beast possible way to display them on the dashboard resulting useful to the whole target audience.
- Build: Once you are fully satisfied with the prototype, now its time to add real data on the dashboard. Find the data and generate queries to power metrics. Create formulas and build transforming charts out of the data. Occasional use of framework to log the metrics, data and formulas makes the creation of queries easier at times.
- Deploy: Yayy! Because now you have a fully functional dashboard that has real data and user can use it. Its now time to share with with the full audience. But job is not done yet. As the usage of the dashboard grows it might change the scale of users and the dashboard needs to be enhanced and maintained.
- By : Rudra Patel